

A note on sourcing. The AI labs behind the frontier models named in this report — Anthropic (Claude Opus 4.8), Google (Gemini 3.1 Pro), and OpenAI (GPT-5.2) — publish almost no model-specific energy data. Nearly every per-query figure below is an independent estimate or an extrapolation from an analogue (e.g., GPT-4o, the median Gemini prompt, Claude 3.7 Sonnet). Figures are labelled Disclosed, Estimated, or Extrapolated throughout. All numbers are hyperlinked to their sources.
TL;DR
- Per-query energy for a frontier LLM is small but highly variable — roughly 0.2–0.4 Wh for a median text query, rising to ~4–40 Wh when reasoning / "extended thinking" is engaged. The only methodologically detailed disclosed figure is Google's median Gemini text prompt at 0.24 Wh.
- The story is no longer per-query intensity — it is aggregate scale. Per-prompt energy is falling dramatically (Google reports a 33× per-prompt energy reduction in 12 months), yet global data-center electricity is still set to roughly double from ~415 TWh (2024) to ~945 TWh by 2030 (IEA) — a textbook Jevons-paradox dynamic.
- Energy scales with active parameters and tokens generated, not headline parameter counts. Mixture-of-experts (MoE), quantisation, and batching decouple capability from per-token compute, while reasoning / test-time compute re-couples it — a 15× increase in reasoning tokens raises median energy ~13× (Microsoft). Embodied (manufacturing) emissions and indirect water are large, growing, and routinely omitted from corporate disclosures.
1. The named frontier models: what is and isn't known
Only Google has published a methodologically detailed per-prompt figure: a median Gemini Apps text prompt uses 0.24 Wh of energy, emits 0.03 gCO2e (market-based), and consumes 0.26 mL of water (August 2025). OpenAI's Sam Altman gave a single undocumented figure — the average query uses about 0.34 watt-hours and ~0.000085 gallons of water (June 2025). Anthropic has disclosed nothing — no per-query energy, no Scope 1/2/3 emissions, no parameter counts.
For the three models discussed in this article Claude Opus 4.8, Gemini 3.1 Pro, and GPT-5.2; no official or independently measured per-query energy figures exist all usable numbers come from analogues.
Claude Opus 4.8 (Anthropic)
A released (~May 2026) hybrid-reasoning model with a configurable effort / budget-tokens control over internal reasoning. Anthropic has published no energy-per-query figure, parameter count, architecture confirmation, or corporate emissions data. The closest sourced analogues come from third-party benchmarking of earlier Claude models: Jegham et al. (2025) estimated Claude 3.7 Sonnet at ~0.8 Wh (short), 2.8 Wh (medium), and 5.5 Wh (long), with its extended-thinking variant at ~17 Wh for long-form input — less than half the ~33 Wh of o3. Notably, Claude 3.7 Sonnet ranked highest in eco-efficiency (0.886) across the 30 models studied.
Gemini 3.1 Pro / Gemini 3 Pro (Google)
Google's official Gemini 3 Pro model card confirms a sparse mixture-of-experts (MoE) transformer that activates a subset of parameters per token. Parameter counts are not officially disclosed. The closest official energy figure is the median Gemini Apps text prompt: 0.24 Wh / 0.03 gCO2e / 0.26 mL water. Accounting caveat: Google's 0.03 gCO2e uses a market-based method; under a location-based approach emissions would be closer to 0.09 gCO2e — roughly three times higher.
GPT-5.2 (OpenAI)
Released December 2025 with Instant/Thinking/Pro tiers. OpenAI has published no per-query energy figure for any GPT-5.x model. The most-cited estimate, from the University of Rhode Island AI Lab for GPT-5, is ~18 Wh per medium response, up to ~40 Wh with extended reasoning — roughly 8× GPT-4. For the non-reasoning baseline, Epoch AI estimates a typical GPT-4o query at ~0.3 Wh.
2. Per-query energy across models
The single most important visual in this report is also the most counterintuitive: per-query energy spans more than two orders of magnitude, and the deciding factor is not how large a model is but whether it engages reasoning / test-time compute. A short prompt to a small model and a long reasoning prompt to a frontier model are not variations on a theme — they are different orders of magnitude of energy, separated by a factor of several hundred.
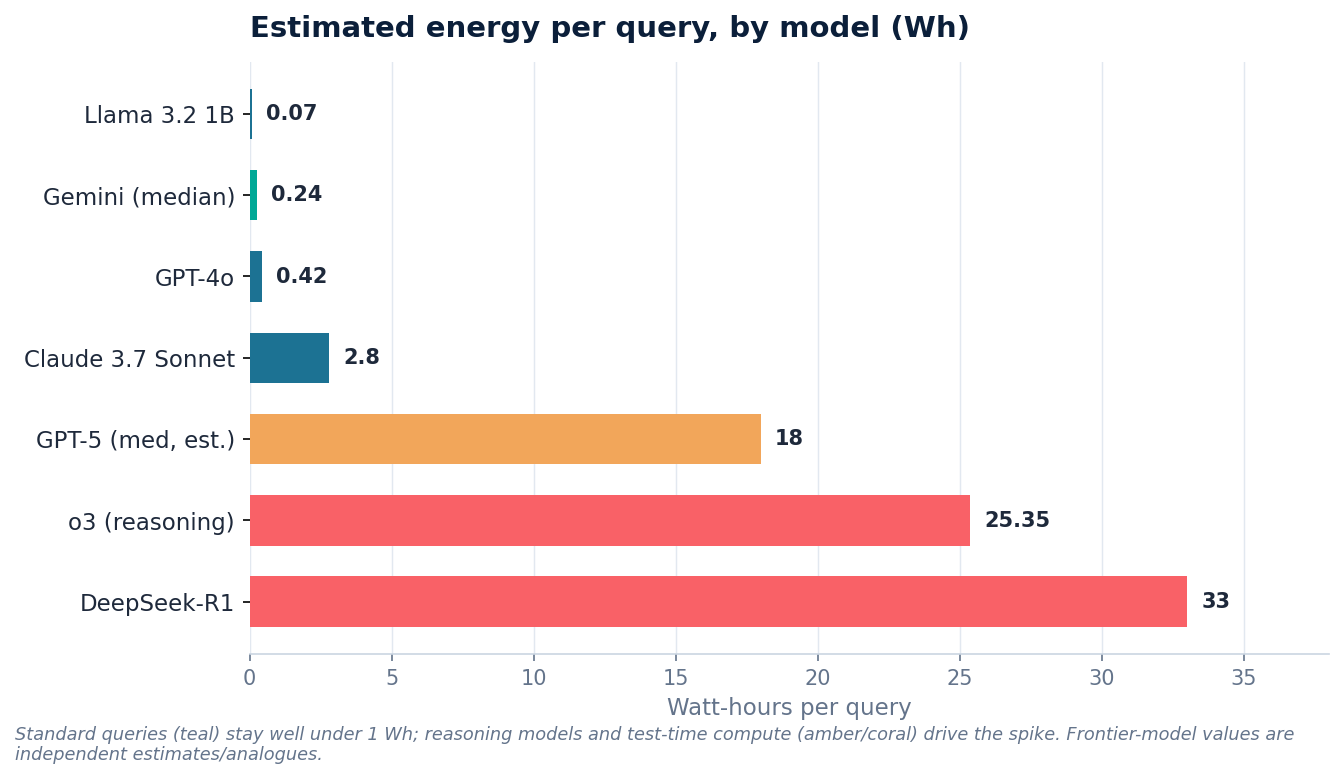
What Figure 1 shows is two distinct regimes. At the bottom sit the everyday, non-reasoning queries — a small open model like LLaMA-3.2-1B at roughly 0.07 Wh, Google's median Gemini text prompt at 0.24 Wh, and a GPT-4o-class response at around 0.42 Wh. These are the queries that dominate real-world usage, and they are genuinely cheap: a median Gemini prompt consumes about as much electricity as running a microwave for one second, or roughly nine seconds of watching television. For this category of request, the per-query footprint is close to a rounding error against a person's daily energy use.
The top of the chart tells a different story. Once a model is asked to "think" — generating long internal reasoning chains before answering — energy consumption climbs by one to two orders of magnitude. The estimated 18–40 Wh for a medium GPT-5 response, the 25 Wh for an o3 query, and the 33 Wh for a long DeepSeek-R1 response are not anomalies; they are the predictable cost of test-time compute. The mechanism is straightforward: a reasoning model produces far more tokens per answer, and energy scales with tokens generated. Microsoft's analysis found that a roughly 15× increase in reasoning tokens raised median energy about 13×, and reasoning models have been observed generating hundreds of extra tokens even for trivial multiple-choice questions. Claude 3.7 Sonnet is instructive here as a middle case: in its standard mode it sits in the efficient band (0.8–5.5 Wh depending on prompt length), but switching on extended thinking pushes the same model to roughly 17 Wh — a single architectural model spanning much of the chart depending only on how it is invoked.
Table 1 — Per-query energy estimates by model
| Model | Energy/query (Wh) | Type | Basis |
|---|---|---|---|
| LLaMA-3.2-1B | 0.07 (short) | Estimated | Jegham et al. 2025 |
| Gemini (median text prompt) | 0.24 | Disclosed | Google Cloud 2025 |
| GPT-4o | 0.42 (short), 1.79 (long) | Estimated | Jegham et al. 2025 |
| Claude 3.7 Sonnet | 0.8 / 2.8 / 5.5 (short/med/long) | Estimated | Jegham et al. 2025 |
| Claude 3.7 Sonnet (extended thinking) | ~17 (long) | Estimated | Jegham et al. 2025 |
| GPT-5 (medium) | ~18, up to 40 | Extrapolated | URI AI Lab |
| o3 (reasoning) | 25.35 | Estimated | Jegham et al. 2025 |
| DeepSeek-R1 | 20.9–33+ (long) | Estimated | Jegham et al. 2025 |
The "Type" column in Table 1 deserves as much attention as the numbers themselves, because it reveals how little of this data is actually known rather than inferred. Exactly one figure in the table is disclosed by the company that operates the model — Google's 0.24 Wh median prompt, and even that comes with the caveat that it is a fleet-wide median for text prompts only, measured under a methodology Google itself defined. Every other row is either an independent estimate (chiefly from Jegham et al.'s 2025 cross-model benchmark, which has the virtue of applying one consistent methodology across all 30 models it studied) or an extrapolation (the GPT-5 figure, reverse-engineered from response times and assumed hardware power draw, carries wide acknowledged uncertainty). The practical consequence is that the table should be read as a map of relative magnitudes — the gap between regimes is robust and well-supported — rather than as a precise ledger. Cross-company comparisons in particular are fragile, since the underlying studies differ in assumed prompt length, hardware, data-center efficiency, and whether they count short, medium, or long responses.
The strategic takeaway for anyone deploying these models is that model and mode selection is itself the dominant lever on inference energy — far more so than any single efficiency tweak. Routing a simple classification or extraction task to a small or non-reasoning model, and reserving extended-thinking modes for problems that genuinely require multi-step reasoning, can change the energy and carbon profile of a workload by 50× or more. The chart is, in effect, a procurement decision tree disguised as an energy plot.
3. Operational emissions: PUE, grid intensity, and location
The energy a query consumes inside a chip is only part of its emissions story. Two multipliers sit between raw compute and the carbon that actually reaches the atmosphere: how much overhead energy the data center burns to keep that chip running and cooled, and how dirty the electricity feeding it is. Both vary enormously between operators and locations, and together they explain why two identical queries can have wildly different carbon footprints.
The first multiplier is power usage effectiveness (PUE) — the ratio of total facility energy to the energy that actually reaches the computing hardware. A PUE of 2.0 means every watt of compute requires another watt of cooling, power conversion, and lighting; a PUE near 1.0 means almost all the energy goes to useful work. The gap between best-in-class and average is large: Google's 2024 fleet-wide PUE was 1.09 against an industry average of roughly 1.56. In practical terms, a hyperscaler running at 1.09 wastes about 9% of its energy on overhead, whereas a typical facility at 1.56 wastes more than a third — so the same model on the same hardware can carry meaningfully different emissions purely as a function of where it is hosted. This is one reason per-query figures self-reported by the most efficient operators tend to look favourable: their infrastructure genuinely is cleaner, but the numbers are not representative of the long tail of smaller and older data centers.
The second and larger multiplier is grid carbon intensity — how much CO2 is emitted per kilowatt-hour of electricity, which depends entirely on the local generation mix. The same computation can be nearly carbon-free on a nuclear- or hydro-heavy grid and heavily polluting on a coal-heavy one. The training and deployment of BLOOM is the clearest illustration: its training ran on the nuclear-heavy French grid at about 57 gCO2/kWh, while its inference API ran in a region at 394 gCO2/kWh — a roughly sevenfold difference in carbon per unit of identical work, driven by nothing but geography. This location-dependence also explains the width of credible industry estimates: the de Vries-Gao 2025 emissions range is driven largely by US grid intensities spanning 0.17 to 0.46 tCO2/MWh, nearly a threefold spread within a single country. It is also why corporate carbon claims hinge on an accounting choice — market-based methods that credit clean-energy purchases versus location-based methods that reflect the actual grid — and why the same prompt can be reported at very different carbon figures depending on which convention an operator adopts.
Stack these multipliers on top of the per-query energy variation from Section 2 and the result is a near-meaningless headline range unless every assumption is pinned down. Per-query CO2 estimates run from roughly 0.03 g to 68 g depending on model, query type, and grid — a spread of more than three orders of magnitude. The lesson is not that any one of these figures is wrong, but that a carbon number for "an AI query" is uninterpretable without three pieces of context: which model and mode, on what data-center efficiency, drawing from which grid. A small non-reasoning model on an efficient hydro-powered facility and a reasoning model on an average coal-heavy grid are both "AI queries," and they sit at opposite ends of that thousand-fold range.
4. Embodied / lifecycle emissions and water
Most discussion of AI's footprint stops at electricity, but two large categories sit outside the meter entirely: the carbon emitted to manufacture the hardware before it ever runs a query, and the water consumed to cool it and to generate its power. Both are routinely omitted from corporate disclosures, and both are growing fast enough that ignoring them increasingly understates the true picture.
The manufacturing footprint — embodied carbon — is the emissions debt a chip carries on day one, before it has done any useful work. It is substantial: NVIDIA's HGX H100 baseboard, which holds eight GPUs, embodies about 1,312 kg CO2e, or roughly 164 kg per card, with high-bandwidth memory (HBM) making up the largest single share. That detail matters for where the problem is heading, because HBM is exactly the component scaling fastest as models grow more memory-hungry. TechInsights forecasts AI-GPU manufacturing emissions rising more than twelvefold, from 1.8 Mt CO2 in 2024 to 21.6 Mt by 2030, driven increasingly by those memory stacks. In other words, the embodied share is not a fixed tax but a rising one, and it is concentrating in the part of the chip that frontier inference depends on most.
How much embodied carbon matters relative to operational energy depends on how hard and how long the hardware is used. For BLOOM-176B, embodied emissions accounted for roughly 22% of the model's total lifecycle footprint — not dominant, but far from negligible. The general rule is that embodied carbon's share rises as utilisation falls: a GPU running flat-out for years amortises its manufacturing debt across an enormous number of queries, while one sitting idle or retired early spreads the same fixed cost over far less useful work. As the industry races to install hardware ahead of demand, under-utilised accelerators push the embodied share higher than steady-state figures suggest.
Water is the second off-meter cost, and it has a hidden structure that makes headline numbers misleading. There is direct water — what a data center evaporates to cool its servers — and indirect water — what is consumed upstream at power plants to generate the electricity it draws. The two differ by more than an order of magnitude. Google's data centers consumed about 7.7 billion gallons globally in 2024, a direct-cooling figure. But the fuller accounting is starker: US data centers used roughly 17 billion gallons directly while consuming about 211 billion gallons indirectly through electricity generation — some twelve times the direct figure. A "drops per prompt" claim that counts only cooling water therefore captures less than a tenth of the real water intensity, and the part it omits is the part tied directly to how much electricity — and so how much compute — the model consumes.
It is worth separating these ongoing operational costs from the one-time training footprint summarised in Table 2. Training a frontier model is energy-intensive in absolute terms, but it happens once and is then amortised across the model's entire operational life.
| Model | Training energy | Training CO2e | Source |
|---|---|---|---|
| GPT-3 (175B) | 1,287 MWh | 552 t (net) | Patterson et al. 2021 |
| PaLM-540B | ~3,436 MWh | ~271 t (net) | Chowdhery et al. 2022 (PaLM), App. B |
| GPT-4 (est.) | ~50–62 GWh | ~5,184–15,000 t (est., grid-dependent) | Stanford AI Index 2025 / Epoch AI; Ludvigsen |
| BLOOM-176B | 433 MWh (dynamic, final run) | 50.5 t (full lifecycle, incl. embodied) | Luccioni et al. 2023 (JMLR) |
The numbers in Table 2 are large — GPT-4's training run is estimated to have emitted somewhere in the range of 5,000 to 15,000 tonnes of CO2e — but their significance shrinks once spread across the billions of queries a popular model serves. This is the crucial framing for the rest of this report: for any widely-deployed model, inference, not training, dominates lifetime emissions. A one-off 552-tonne training cost for GPT-3 is dwarfed over time by the cumulative energy of serving it to millions of users, which is why the aggregate-growth story in Section 6 — and the shift toward token-hungry reasoning at inference time — matters far more for AI's long-run footprint than the headline cost of any single training run. Training is a fixed deposit; inference is the recurring bill, and it is the recurring bill that is scaling.
5. How energy scales with parameters, architecture, and tokens
This was the original question behind the report: as models get bigger, how does their energy use grow? The short answer is that the intuitive version — "energy scales with parameter count" — is only half right. Energy per query scales with two things multiplied together: the active parameters touched per token, and the number of tokens generated. Modern architecture has worked hard to suppress the first term, while reasoning has inflated the second — which is why headline parameter counts are now a poor guide to a model's real footprint.
Start with the clean case. For a dense transformer, each generated token requires roughly two floating-point operations per parameter (~2N FLOPs), so in principle energy per token rises in near-lockstep with model size. The empirical data broadly bears this out across the open-model family: a small model like Llama 3.1 8B draws on the order of ~114 joules per response, while the 405B version draws closer to ~1.9 Wh — and Llama-3-70B sits around 1.7 Wh per query. Scaled across the full range, the largest open models consume on the order of 30,000× more energy than a GPT-2-class model. For dense models, then, the old intuition holds: bigger is proportionally hungrier.
Mixture-of-experts (MoE) is what breaks the relationship — and it is now standard at the frontier (Gemini 3 Pro's confirmed architecture, and the widely-assumed design of GPT-4 and others). An MoE model has a very large total parameter count but routes each token through only a fraction of it. GPT-4 is estimated to activate roughly 280B of its ~1.8T parameters per token, so its per-token compute resembles a ~280B dense model rather than a 1.8T one. This is why a trillion-parameter headline figure overstates per-query energy: capability scales with total parameters, but compute scales with active ones. The caveat is memory — every expert must still be held in GPU memory even when idle, so real-world energy sits somewhat above what the active-FLOPs count alone would predict.
A cluster of software and hardware techniques pushes per-token energy down further without sacrificing capability. Google credits quantisation, speculative decoding, model distillation, and large batch sizes as the levers behind its dramatic per-prompt efficiency gains. Quantisation — running the model at lower numerical precision (FP8 or FP4 rather than FP16) — roughly doubles or quadruples the work done per joule; distillation trains a small model to mimic a large one; speculative decoding lets a cheap model draft tokens that the expensive model only has to verify. Together these are why the per-query figures in Section 2 keep falling even as models grow more capable.
Then test-time compute re-couples energy to output and undoes much of that progress for any given query. Reasoning models generate long internal chains of thought before answering, and energy scales with tokens generated — so the more a model "thinks," the more it costs. Microsoft's analysis found that a roughly 15× increase in reasoning tokens raised median energy about 13×, and the effect appears even on trivial questions, where reasoning models emit hundreds of tokens to answer something a standard model dispatches in a few dozen. This is the single most volatile term in the whole equation: it can move a query's energy by one to two orders of magnitude (the regimes visible in Figure 1), and it is governed not by model size but by how the model is invoked.
The synthesis, then, is that "energy scales with model size" should be replaced with a more accurate formulation: energy per query ≈ active parameters per token × tokens generated × (data-centre and hardware efficiency factors). Architecture (MoE) and the efficiency levers have steadily shrunk the first term; reasoning has inflated the second. A frontier model can therefore be simultaneously more capable, more parameter-rich, and more efficient per token than its predecessor — while still costing far more per task, simply because it generates more tokens. Parameter count alone tells you very little; the tokens term is now where the action is, and it leads directly into the volume story of Section 6.
6. Aggregate / fleet-level growth and projections
Per-query efficiency is improving fast — but it is being outrun by volume. This divergence is the central climate concern of the whole report, and it is worth stating plainly before the numbers: the fact that each individual query is getting cheaper does not mean AI's total footprint is shrinking. It is growing, and quickly, because the number of queries is rising faster than the energy cost of each one is falling. Sections 2 through 5 established that a single inference is small and getting smaller; this section establishes that the fleet is large and getting larger. Both things are true at once, and reconciling them is the key to reading any headline about AI energy honestly.
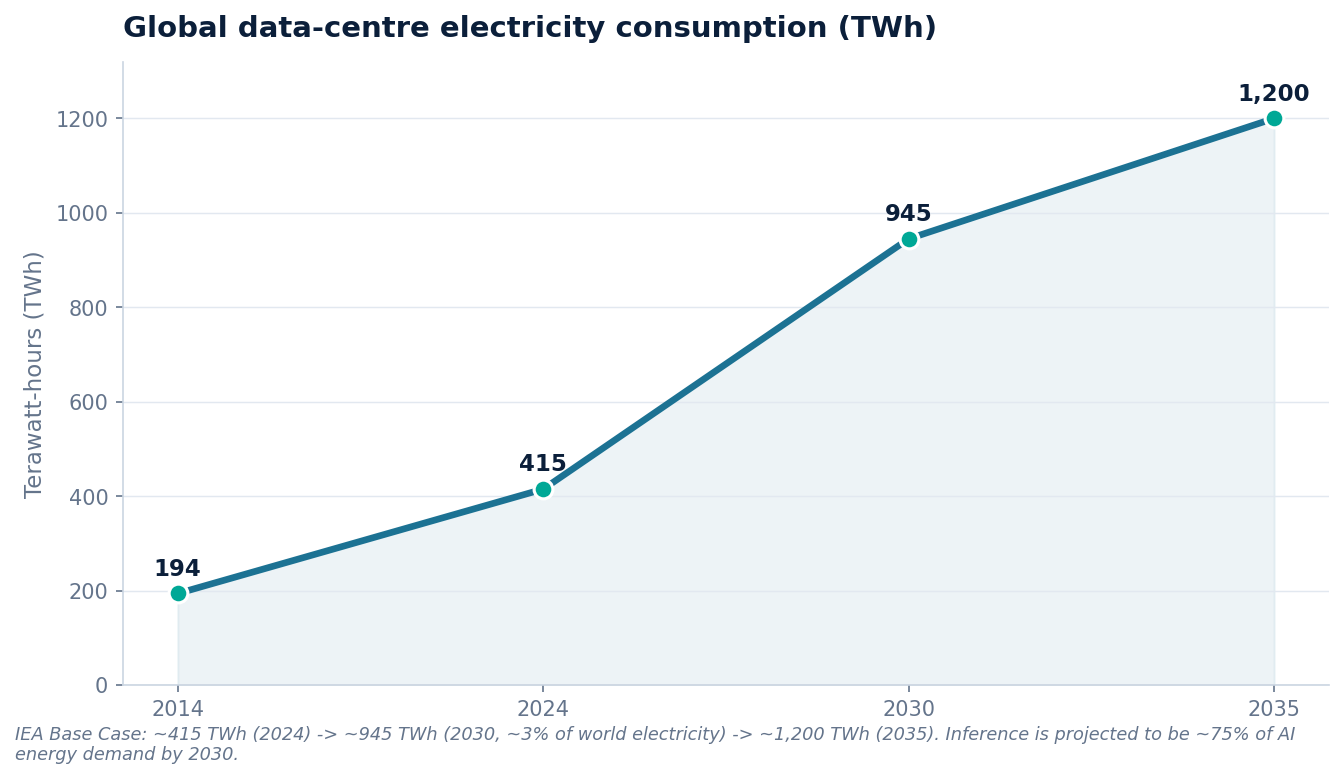
The headline trajectory comes from the IEA: global data-centre electricity is projected to double to ~945 TWh by 2030 (just under 3% of total global electricity), growing roughly 15% per year. That growth rate is the number to hold onto. Fifteen percent a year is more than four times the pace at which overall electricity demand is rising, which is why data centres have moved from a rounding error in energy planning to a line item that utilities, grid operators, and governments now model explicitly. Figure 2 shows the shape of it: a gentle climb through the 2010s, an inflection around the early 2020s as generative AI scaled, and a near-doubling in the six years to 2030.
What makes this an AI inference story rather than a generic data-centre story is where inside that total the growth is concentrated. Inference accounts for roughly 80–90% of AI computing and is expected to represent about 75% of total AI energy demand by 2030 — training is now the minority. This is the empirical backbone of the "fixed deposit versus recurring bill" framing from Section 4: the one-off cost of training a model, however eye-catching, is dwarfed over time by the cumulative cost of serving it. The fleet-level curve in Figure 2 is, in effect, the sum of billions of the individual queries plotted back in Figure 1 — and it is bending upward precisely as those queries shift toward the token-hungry reasoning modes that sit at the expensive end of that chart.
Table 3 — Major aggregate growth projections
| Source | Projection | Link |
|---|---|---|
| IEA (Base Case) | ~415 TWh (2024) → ~945 TWh (2030) → ~1,200 TWh (2035); ~15%/yr | IEA |
| LBNL (US) | 176 TWh (2023, 4.4%) → 325–580 TWh (6.7–12%) by 2028 | Carbon Credits |
| EPRI (US) | 9–17% of US electricity by 2030 (2026 update) | National Law Review |
| Goldman Sachs | +165% global DC power demand by 2030 vs. 2023 | Goldman Sachs |
| McKinsey | ~156 GW AI capacity & ~$5.2T investment by 2030 | Aleasoft |
| de Vries-Gao (2025) | AI: 32.6–79.7 Mt CO2 & 312–765 bn L water in 2025 | Patterns |
| Cornell (2025) | US AI data centers +24–44 Mt CO2/yr by 2030 | Cornell Chronicle |
Table 3 deliberately gathers projections from very different kinds of organisation — an intergovernmental energy agency, a US national laboratory, an industry research institute, two investment banks, and two academic groups — and the striking thing is how much they agree on direction even where they differ on magnitude. The LBNL analysis of US data centres puts them at 176 TWh in 2023 (4.4% of national electricity) and rising to 325–580 TWh, or 6.7–12%, by 2028; EPRI's 2026 update sees 9–17% of US electricity going to data centres by 2030; and Goldman Sachs models a 165% increase in global data-centre power demand by 2030 against a 2023 baseline. The wide internal ranges — LBNL's 325 to 580 TWh spans nearly a factor of two — are not sloppiness; they reflect genuine uncertainty about how fast capacity gets built, how quickly hardware efficiency improves, and how much announced construction actually materialises. The honest reading of Table 3 is therefore directional: every credible forecaster expects steep growth, but nobody can pin the 2030 figure to within a comfortable margin.
The emissions and resource consequences follow the energy curve, with the same caveats. The de Vries-Gao analysis attributes 32.6–79.7 Mt of CO2 and 312–765 billion litres of water to AI systems in 2025 alone, and Cornell researchers project US AI data centres adding 24–44 Mt of CO2 per year by 2030. These ranges inherit all the uncertainty of the energy projections beneath them and then add a second layer — grid carbon intensity and water-sourcing both vary by location, as Section 3 and Section 4 detailed — so they should be read as order-of-magnitude signals rather than precise accounts. McKinsey frames the same trajectory in capital terms: roughly 156 GW of AI-related capacity and on the order of $5.2 trillion of investment by 2030, a reminder that this is not a hypothetical projection but one already being underwritten by committed money and steel.
The throughline connecting every row of Table 3 back to Figure 1 is the mechanism named at the top of this section: the efficiency gains are real, but demand is price-elastic, so cheaper queries beget far more queries. This is the Jevons paradox applied to inference — a pattern explored in detail in Section 7 — and it is why a report that opened by showing how small an individual AI query is must close by showing how large the aggregate has become. The two facts are not in tension; the second is a consequence of the first.
7. The efficiency-vs-volume paradox
The decision-relevant insight of this entire report is that per-query efficiency gains are being outrun by volume growth and the shift to reasoning models. This is not a contradiction to be resolved but a dynamic to be understood: the same forces that make each query dramatically cheaper are precisely what drive total consumption upward. Efficiency is not the brake on AI's footprint that intuition suggests — under the right demand conditions, it is the accelerator.
The efficiency gains themselves are genuine and large. Google reports a 33× drop in per-prompt energy and a 44× drop in per-prompt carbon over a single 12-month period, decomposing the energy figure into roughly 23× from model and software improvements multiplied by about 1.4× from better hardware utilisation. That is an extraordinary rate of improvement for any technology, let alone over twelve months. The same trend appears on the cost side, which tracks energy closely because compute is the dominant variable cost of inference: the price to query a GPT-3.5-equivalent model fell from $20.00 to $0.07 per million tokens — more than 280× — between November 2022 and October 2024. Whether measured in joules or dollars, the cost of a unit of AID output has collapsed.
Intuitively, collapsing per-unit cost should collapse total consumption. It does the opposite, and the reason is the Jevons paradox — the observation, first made about coal in the 19th century, that when efficiency makes a resource cheaper to use, falling unit costs can drive total demand up rather than down, provided that demand is elastic enough to respond. AI inference is a near-textbook case. Every order-of-magnitude drop in the cost of a query opens up whole categories of use that were previously uneconomic: embedding a model in every search result, every document editor, every customer-service flow, every line of code written. Cheapness does not satisfy demand; it manufactures it. The 280× cost decline did not leave the total inference bill 280× smaller — it left it larger, because it summoned far more than 280× the volume of queries.
The result is the divergence at the heart of Section 6: aggregate data-centre electricity still roughly doubles by 2030 even as each individual query grows radically more efficient. The two curves — per-query energy falling, total energy rising — are not in conflict; the second is the direct consequence of the first. A reader who looks only at the per-prompt figure will conclude AI is decarbonising; a reader who looks only at the aggregate will conclude it is spiralling. Both are looking at the same system, and only the combination tells the truth.
Compounding the volume effect is a second, newer force pulling in the same direction: the shift in what kind of query is becoming standard. The efficiency gains above were largely won on conventional, single-pass inference — but the industry is simultaneously moving toward reasoning models that generate long internal chains of thought before answering, and that reasoning-model energy tier of roughly 4–40 Wh is becoming the default rather than the exception. As Section 2 showed, this is a one-to-two order of magnitude jump in per-query energy. So even as the cost of a given query falls, the typical query is migrating from the cheap end of Figure 1 to the expensive end. Efficiency is pushing per-query energy down while the reasoning shift pushes it back up — and on top of both, sheer volume climbs. The net direction, as every projection in Table 3 agrees, is up.
The practical upshot ties the whole report together. Efficiency improvements are necessary and worth pursuing, but they are not, on their own, a climate strategy — because in an elastic market they are partly self-defeating. Containing AI's aggregate footprint depends on the things efficiency cannot deliver by itself: decarbonising the grids that data centres draw from, so that rising demand is met with rising clean supply rather than gas; making deliberate choices about when expensive reasoning is actually warranted rather than defaulting to it; and treating the model-and-mode selection of Section 2 as the genuine lever it is. The per-query number is a story of remarkable engineering progress. The aggregate number is a story of where that progress is taking us. The gap between them is the paradox, and closing it is a policy and procurement problem, not an efficiency one.
8. Recommendations
The findings above point to four practical recommendations — two for anyone reporting on AI's footprint, and two for anyone procuring it. They share a common thread: most confusion in this area comes from comparing numbers that aren't comparable, or from looking at one part of the system and mistaking it for the whole.
1. Band every figure as Disclosed / Estimated / Extrapolated. The single most important discipline in this field is labelling the provenance of every number, because the gap between a measured figure and a reverse-engineered guess is often larger than the differences between models. As Sections 1 and 2 established, only Google's 0.24 Wh median prompt and Altman's 0.34 Wh are "disclosed" anchors — and even those carry methodological caveats. Every frontier-model number, including all figures for the models this report was asked about, should be treated as an analogue or estimate, not a measurement. A report that presents a reverse-engineered 18 Wh GPT-5 figure with the same confidence as Google's disclosed 0.24 Wh is not being precise; it is laundering a guess into a fact.
2. Lead with the scaling story, not the per-query number. The per-query figure is the most cited and the most misleading number in the entire debate, because it is small, intuitive, and tells you almost nothing about the aggregate trajectory. The genuinely decision-relevant insight is the divergence — per-query energy falling even as total energy climbs — and that only becomes visible when both are shown together. Plotting per-query energy and aggregate TWh on the same timeline, as this report does across Figures 1 and 2, is the clearest way to defuse the two opposite errors: the optimist's "queries are getting cheaper, so we're fine" and the alarmist's "AI is boiling the oceans." Both collapse once the two curves are seen side by side.
3. Always pair operational with embodied + water. Most footprint claims count only the electricity a query draws and stop there — which, as Section 4 showed, can capture less than half the true picture. Embodied carbon from manufacturing is rising more than twelvefold by 2030, and indirect water consumed at the power plant runs roughly twelve times the direct cooling water a data centre reports. A disclosure that omits these isn't merely incomplete; it systematically understates, because the omitted categories are precisely the ones growing fastest and hardest to offset. Any credible accounting should state its system boundary explicitly — operational only, operational plus embodied, or full lifecycle — and should distinguish market-based from location-based carbon, since that single accounting choice can move a headline figure by 3× (as Google's 0.03 vs. ~0.09 gCO2e per prompt illustrates).
4. For organisations procuring AI, model and mode choice is itself a sustainability decision. The energy spread between the lightest and heaviest options exceeds 200× (Section 2), which means routing and configuration decisions dwarf any after-the-fact efficiency tweak. Three levers matter most. First, match the model to the task: a small or distilled model handles classification, extraction, and routine drafting at a fraction of a frontier model's cost, and should be the default unless the task genuinely demands more. Second, treat reasoning as a dial, not a default: as the per-token-versus-per-task distinction in Section 7 made clear, the cost and energy of an individual token keep falling, but the cost per task at the frontier is rising because high-reasoning modes generate vast volumes of intermediate thinking tokens. That spend is a choice — reserve extended thinking for problems that actually require multi-step reasoning, and the per-task cost falls back toward the cheap end of the curve. Third, site for the grid: the same workload on a clean-grid region can emit a fraction of what it does on a coal-heavy one (Section 3), so region selection is a first-order carbon decision, not a detail. Taken together, these turn "using AI responsibly" from a vague aspiration into a set of concrete, measurable procurement choices.
9. Caveats
Every figure in this report should be read with its limitations in view. The honest summary is that this is a field where the questions are sharp but the data is soft — and a responsible reading depends on knowing exactly how soft, and where. Four caveats matter most.
Disclosure is poor, so most numbers are estimates rather than measurements. This is the foundational limitation from which the others follow. With the narrow exceptions of Google's median-prompt figures and a handful of corporate sustainability disclosures, nearly every per-query number in circulation — including most of those here — is either an independent estimate or a company self-report, not an externally audited measurement. The specific models this report set out to examine compound the problem: they are too new for any primary data to exist, their parameter counts are trade secrets, and only Gemini 3 Pro's mixture-of-experts architecture is officially confirmed at all. The frontier-model figures throughout should therefore be understood as informed analogues — useful for establishing relative magnitudes and orders of magnitude, but not as precise accounts of any particular model.
Boundary inconsistency makes cross-company comparison largely invalid. Even where numbers are disclosed, they are rarely measuring the same thing. Direct cooling water versus total indirect water, market-based carbon (which credits clean-energy purchases) versus location-based carbon (which reflects the actual grid), and median versus average query energy are all routinely conflated, and each choice can move a headline figure by a factor of several. The practical consequence is that ranking companies or models against one another on these numbers is usually meaningless unless every figure has been normalised to the same system boundary — which, in published material, it almost never has. Comparisons within a single consistent study (such as the cross-model benchmark used for Figure 1) are far more trustworthy than comparisons stitched together across sources.
Projections are modelled scenarios, not forecasts. The aggregate-growth figures in Section 6 — the doubling to 945 TWh, the various national-share estimates — are the outputs of models with explicit assumptions about build-out rates, hardware efficiency, and adoption, and their wide internal ranges reflect genuine uncertainty rather than precision. They should be read as directional rather than exact: every credible forecaster agrees on steep growth, but the specific 2030 number is not pinnable to a tight margin. It is also worth remembering that past exponential IT-growth forecasts have sometimes proven inaccurate, with earlier data-centre-energy panics partly defused by efficiency gains that the projections of the day underweighted. That is a reason for humility in both directions — the growth could undershoot these scenarios as easily as overshoot them.
Some key sources carry a framing interest or large inherent uncertainty. A few of the most-cited inputs deserve a flag. Microsoft's arXiv perspective arguing that public energy estimates are too high is methodologically substantive but authored by a hyperscaler with a clear interest in how the issue is framed, and should be weighed accordingly. At the other end, the widely-repeated University of Rhode Island GPT-5 figures are reverse-engineered from response times and assumed hardware draw, and carry uncertainty bands wide enough that the central estimate should not be treated as authoritative. None of this means these sources are wrong — only that a reader should know whose hand is on the scale and how heavy the error bars are before leaning on any single figure.
Taken together, these caveats do not undermine the report's central conclusions, which rest on directional patterns that hold across many independent sources: per-query energy is small and falling, aggregate demand is large and rising, inference dominates, and the reasoning shift is pushing per-task energy back up. What the caveats do undermine is false precision — the temptation to treat any specific watt-hour or tonne figure as settled. The trends are robust; the decimal points are not.
Report compiled June 2026. All figures hyperlinked to sources. Frontier-model energy values (Claude Opus 4.8, Gemini 3.1 Pro, GPT-5.2) are analogues/estimates, not measured values — do not present them as disclosed figures.